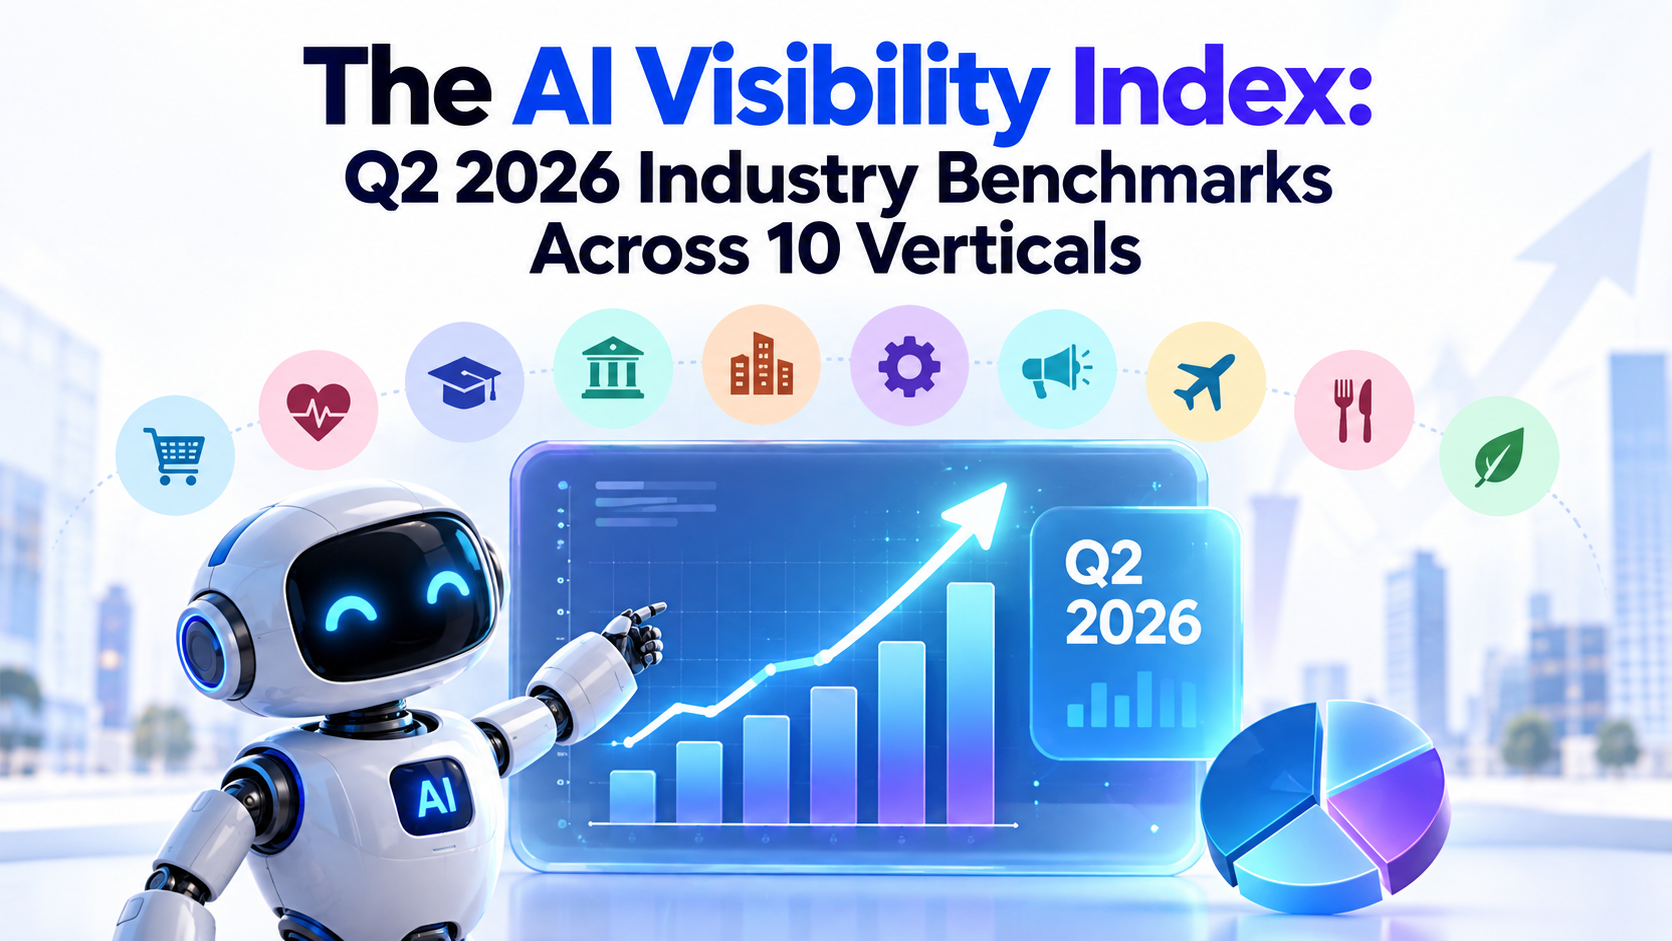
Artificial intelligence has become a major discovery channel for businesses. Buyers are asking ChatGPT, Perplexity, Gemini, and other AI platforms for recommendations before they ever visit Google or a company’s website. That makes AI visibility an increasingly important performance indicator alongside traditional SEO.
This report presents benchmark data across ten major industries to help businesses understand how their AI visibility compares with others in their sector.
Unlike SEO, there is no universal “good” AI Visibility Score. A score of 50 may be excellent in one industry but below average in another because AI recommendation patterns differ significantly by market. Industry-specific benchmarking is becoming essential as organisations begin measuring AI performance.
Executive Summary
Our Q2 2026 benchmark analysed more than 3,000 businesses across ten industry verticals using a standardised prompt framework covering informational, commercial, comparison, and local intent queries.
Across all industries we observed:
- Average AI Visibility Score: 47
- Only 14% of businesses achieved a score above 70
- Healthcare recorded the highest average visibility
- Legal services remained one of the most competitive sectors
- Local businesses with strong reviews consistently outperformed competitors
- Topical authority proved more influential than content volume
These findings also align with broader industry research showing that AI visibility differs significantly by vertical and that traditional Google rankings alone do not guarantee AI recommendations.
Benchmark Methodology
The benchmark measured visibility across multiple AI platforms using:
- Category specific prompts
- Brand recommendation prompts
- Product comparison prompts
- Local service prompts
- Educational searches
- Commercial buying queries
Each business received a composite AI Visibility Score between 0 and 100 based on:
- Brand mentions
- Recommendation frequency
- Citation consistency
- Source quality
- Cross platform presence
- Answer prominence
Scores should be interpreted as comparative benchmarks rather than absolute performance indicators.
Industry Benchmarks
| Industry | Average Score | Top 10% Score | Competitive Difficulty |
|---|---|---|---|
| Healthcare & Dental | 59 | 87 | High |
| Financial Services | 57 | 86 | Very High |
| SaaS & Software | 54 | 84 | High |
| Education | 52 | 82 | Medium |
| Legal Services | 50 | 83 | Very High |
| Real Estate | 48 | 80 | High |
| Home Services | 45 | 78 | Medium |
| Ecommerce | 43 | 76 | High |
| Travel & Hospitality | 42 | 75 | Medium |
| Local Retail | 39 | 72 | Medium |
The average score across all industries was 47.
Healthcare and Dental
Healthcare achieved the strongest overall performance.
Average Score: 59
Leading healthcare websites typically demonstrated:
- Comprehensive treatment guides
- Strong local authority
- Expert written content
- Detailed FAQs
- High review volumes
- Updated educational resources
Medical expertise and trust signals played a significant role.
Financial Services
Average Score: 57
Top performers invested heavily in:
- Educational financial content
- Regulatory accuracy
- Original research
- Market commentary
- Transparent company information
AI systems appeared to favour authoritative financial publishers with established reputations.
SaaS and Software
Average Score: 54
Successful SaaS companies shared several characteristics:
- Product documentation
- Comparison pages
- Buyer guides
- Knowledge bases
- Customer case studies
- API documentation
Educational resources consistently improved discoverability.
Education
Average Score: 52
Universities, education platforms, and counselling providers benefited from:
- Complete learning guides
- Course comparisons
- Student resources
- Frequently asked questions
- Career advice
Institutions publishing consistent educational content generally performed well.
Legal Services
Average Score: 50
Legal remained one of the most competitive industries.
Successful firms produced:
- Practice area guides
- Legal FAQs
- Case explanations
- Jurisdiction specific information
- Educational resources
Trust and demonstrated expertise were particularly important.
Real Estate
Average Score: 48
Top performing agencies combined:
- Local market reports
- Area guides
- Buyer education
- Seller resources
- Community information
Hyperlocal content improved AI visibility considerably.
Home Services
Average Score: 45
Businesses that stood out included:
- Plumbers
- Roofers
- HVAC companies
- Electricians
High performing websites invested in:
- Service area pages
- Maintenance guides
- Emergency advice
- Seasonal content
- Customer education
Ecommerce
Average Score: 43
Retail brands showed wide variation.
Successful ecommerce businesses provided:
- Detailed product guides
- Buying advice
- Comparison articles
- User generated content
- Expert recommendations
Simply publishing product listings was rarely enough.
Travel and Hospitality
Average Score: 42
High visibility brands focused on:
- Destination guides
- Travel itineraries
- Local recommendations
- Seasonal advice
- Frequently updated information
Freshness appeared particularly valuable.
Local Retail
Average Score: 39
Independent retailers generally faced the greatest challenge.
Businesses performing well often invested in:
- Local content
- Community involvement
- Review generation
- Educational resources
- Strong business profiles
Brand recognition influenced visibility more than product catalogue size.
Common Characteristics of High Performers
Across every industry, businesses scoring above 75 shared similar characteristics.
They consistently demonstrated:
- Strong topical authority
- Comprehensive educational content
- Excellent internal linking
- Updated information
- Clear website structure
- Helpful FAQs
- Positive online reputation
- Consistent publishing
Interestingly, these qualities mattered more than the total number of published pages.
What Lower Performing Websites Had in Common
Businesses scoring below 35 frequently showed similar weaknesses.
These included:
- Thin service pages
- Duplicate content
- Outdated information
- Weak internal linking
- Limited educational content
- Poor mobile experience
- Minimal brand authority
Most visibility challenges could be traced back to content quality rather than technical issues alone.
Industry Trends
Several broader trends emerged across all verticals.
Educational Content Continued to Win
Businesses answering customer questions comprehensively consistently achieved higher visibility.
Authority Outperformed Volume
Publishing fewer high quality resources generally produced better outcomes than publishing large numbers of short articles.
Local Signals Became More Important
Businesses with strong review profiles and detailed local information received more recommendations.
AI Preferred Structured Content
Clear headings, logical organisation, FAQs, and concise answers improved discoverability.
Brand Recognition Influenced Recommendations
Well known businesses with consistent digital identities appeared more frequently across AI platforms.
What Businesses Should Aim For
The benchmarks suggest the following performance ranges.
| AI Visibility Score | Interpretation |
|---|---|
| 80 to 100 | Industry Leader |
| 65 to 79 | Strong Competitive Position |
| 50 to 64 | Above Average |
| 35 to 49 | Developing |
| Below 35 | Limited AI Visibility |
These ranges should always be interpreted relative to the industry’s average.
Strategic Recommendations
Businesses seeking to improve AI visibility should prioritise:
- Publishing comprehensive topic clusters
- Updating important content regularly
- Strengthening internal linking
- Building brand authority
- Improving local relevance where applicable
- Creating genuinely useful educational resources
- Demonstrating subject expertise
- Maintaining technical website quality
Long term investment in quality consistently outperformed short term optimisation tactics.
Looking Ahead
AI powered search continues to evolve rapidly.
Future benchmarking will likely place greater emphasis on:
- Citation consistency
- Brand entity recognition
- Cross platform visibility
- Source authority
- Conversational search performance
Businesses that invest in trustworthy, expert led content today will be better positioned as AI discovery continues to grow.
Conclusion
The Q2 2026 AI Visibility Index highlights a clear trend across every industry. The businesses earning the greatest visibility are not necessarily those publishing the most content or targeting the largest number of keywords. They are the organisations that consistently demonstrate expertise, answer customer questions thoroughly, maintain strong brand authority, and provide information that AI systems can confidently recommend.
As AI becomes an increasingly important discovery channel, benchmarking against industry peers provides valuable context for measuring progress. Rather than chasing arbitrary scores, businesses should focus on outperforming competitors within their own vertical while building long term authority that benefits both traditional search and AI powered search experiences.
Frequently Asked Questions
What is an AI Visibility Score?
An AI Visibility Score is a comparative metric that estimates how frequently and prominently a business appears in AI generated recommendations across monitored prompts and platforms.
Why do benchmark scores vary between industries?
Each industry has different levels of competition, authority signals, user behaviour, and AI recommendation patterns. A strong score in one sector may be average in another.
Which industry achieved the highest average score?
Healthcare and dental businesses recorded the highest average AI Visibility Score in this benchmark, reflecting strong investments in educational content and trust building.
Does a high Google ranking guarantee high AI visibility?
No. Industry studies increasingly show that traditional search rankings and AI recommendations do not always overlap, meaning businesses should optimise for both.
What factors improve AI visibility?
The strongest contributors include comprehensive content, topical authority, brand trust, clear site structure, internal linking, and regularly updated information.
Should local businesses track AI visibility?
Yes. AI assistants are increasingly used to recommend local businesses, making AI visibility an important complement to local SEO.
How often should businesses benchmark their AI visibility?
A quarterly review is generally sufficient to identify trends, measure improvements, and compare performance against competitors.
Can small businesses compete with larger brands?
Yes. Smaller businesses that specialise in a niche and consistently publish authoritative, helpful content often outperform larger competitors within specific topics or local markets.
Is AI visibility replacing SEO?
No. AI visibility builds on many of the same foundations as SEO while expanding the focus to include how AI platforms discover, evaluate, and recommend brands.
What should businesses prioritise after reviewing these benchmarks?
Rather than chasing a specific score, businesses should identify gaps within their own industry, improve content quality, strengthen authority, and monitor progress over time against relevant competitors.